FrameHUD
Reading the panel
Rows read now avg peak in milliseconds: the current frame, the average over the sampling window
(120 frames by default), and the peak since the last reset. other and pipe are summed from other
rows, so they track no peak of their own and stop after avg.
The frame budget is FrameMetrics.DEADLINE (API 31+, what the system allotted the frame) or
1000 / refreshRate. At 60 Hz that is 16.7 ms. A budget set in frameBudgetsMs takes its place.
Whichever is in force is shown in the header.
On a static screen the numbers stop moving. No frames are being produced, so there is nothing to report.
Controls
Drag the panel with a finger. Tap it to step through the three views below, and long-press to freeze: the readings hold still so you can read them while collection continues.
| View | What it shows |
|---|---|
| Full | Every row this page documents, down to the session, memory, thermals and your counters |
| Frames | The verdict, the phases the app owns, TOTAL and the window summary |
| One line | The sparkline, FPS, jank and the phase to blame |
The frames view leaves out the render and GPU stages, over and pipe. The app does not drive
those directly, and when one of them is what went wrong, the verdict on the first line says so.
Three buttons sit in the header. ⧉ asks for the overlay permission, and shows up only while the
panel is stuck inside the app window. ▤ switches between the readings and the worst screens.
× resets the window, the session and the peaks.
Header
- ui N/s: Choreographer ticks the main thread handled in the last second. Drops below the display rate when the main thread is busy; fluctuates on LTPO displays (60↔120)
- FPS: frames actually rendered in the last second.
idlemeans no frames at all: a static screen, or a frozen main thread
CPU (main thread)
Work on the UI thread, where all your Compose and View code lives.
| Row | What it covers | Grows when |
|---|---|---|
input |
Touch and key dispatch, including every onClick/onTouch callback |
Handlers do heavy work |
anim |
Evaluating running animations (Animatable, animate*AsState, Transition) |
Many animations run at once |
layout |
Measure and layout of every View and composable | Deep hierarchies, frequent recomposition, intrinsic measurements |
draw |
Recording draw commands into the display list (Canvas.draw*, text, backgrounds) |
Many elements on screen |
RENDER (render thread)
The Android thread that takes the display list from the UI thread and turns it into GPU work.
| Row | What it covers | Grows when |
|---|---|---|
sync |
Syncing the display list, plus uploading bitmaps as GPU textures | Images are large or newly decoded |
command |
Translating draw commands into OpenGL/Vulkan calls | Hierarchies and layers get complex |
swap |
Waiting for the GPU to finish the previous frame, then presenting this one (eglSwapBuffers) |
The GPU is saturated |
GPU
gpu is the time the GPU spends rasterizing the frame: shaders, textures, layer blending. Needs API 31+
and a driver that reports it. The row reads n/a until real timings arrive, which some drivers never
send.
Everything else
delay: from the vsync signal to the frame actually starting. Grows when the main thread is busy with something else: a heavy callback, IO, or the previous frame still runningother: the remainder of TOTAL not attributed to a phase. Normally near zeroTOTAL: the full frame, vsync to completion. Should stay within budgetover: TOTAL minus budget, the overrun. Negative means headroompipe:cpu|rt|gpu: the stage with the highest average and its timings. The stages run in parallel, so under sustained load the frame rate is bound by this stage, not by TOTAL
Footer
- jank: a frame that missed the budget in force, the system deadline unless
frameBudgetsMsset one - win: jank share, p95 and worst frame over the sampling window
- ses: since the last reset, p50/p95/p99, frame count and collection time (background time
excluded), jank share,
frzfor frozen frames (TOTAL > 700 ms, as in Play Vitals),runfor the longest streak of consecutive janky frames - lost: how far the late frames ran past the deadline, summed. Only shown above zero. Jank share counts an 18 ms frame and a 300 ms frame the same; this keeps them apart
- drop:
FrameMetricsreports the system dropped before delivery. Only shown when above zero: averages and p95 are undersampled, so read them with suspicion - mem: Java heap used/limit and native heap,
▲marking peaks since reset. Climbing as you navigate back and forth means a leak - gc: collections and total GC time since the last reset, counting only while a screen was on top. Rising in step with jank means memory pressure is costing you frames
- therm:
PowerManagerthrottling status and headroom, where 1.0 is the throttling threshold and higher means already throttled. Hidden until the platform reports it - cpu and pss: this process’s CPU time as a share of one core, so two busy cores read 200%, and its proportional set size, both with peaks since the last reset. Sampled every few seconds on a thread of its own, and each is hidden on a device that does not report it
- thr and fd: threads and open file descriptors, sockets and pipes included, with their peaks. Counts that only grow are a leak the frame numbers will not show you
- counters the app keeps through
FrameHud.counter, one row each with the value and its peak. Four rows at most; the rest are counted as+N more counters
Marks
While an interaction is open the header reads ▸ name in place of the timing. It labels what is
under way, not what the figures cover: the rows below stay on the usual window and session, and only
the MarkEnded event reports the mark alone. Marks come from FrameHud.mark in your app; the panel
sets none on its own.
Verdict
The line under the header:
✓ ok: jank below 5%⚠ <phase> N ms: the phase with the highest average,delayincluded; the same phase is marked◀in the list. Yellow at 5–20% jank, red at 20% or more. In the one-line view it shows as a⚠<phase>badge
Colors
Metric rows: green means TOTAL is within budget, grey is normal, red means the window average is above budget.
FPS against the display refresh rate: green at 95% of target or better, grey at 75% or better, red below that.
Jank: below 5% is fine, 5–20% stutters, 20% and up is bad.
How to read it
The current value jumps around; that is fine. Read the average.
- FPS against the refresh rate: matching means smooth
- TOTAL average: below budget is good
- jank: the share of frames that missed the deadline
- p95: sustained drops
- max: one-off spikes. A high max with a healthy p95 is a single hitch, not a problem
- pipe: which stage caps the frame rate under load
Measuring a screen
- Open the screen
- Reset (
×) - Exercise it for 5–10 seconds: scroll, navigate, animate
- Read FPS against the refresh rate, TOTAL average, jank and p95
- If it looks bad, the verdict and
pipepoint at the culprit
When something is red
| Row | What to do |
|---|---|
input |
Heavy work in touch/click handlers. Move it off the callback |
anim |
Too many or too complex concurrent animations. Simplify, drop the redundant ones |
layout |
Recomposition. remember, derivedStateOf, fewer invalidations |
draw |
Too many elements on screen. LazyColumn, remove what is not needed |
sync |
Heavy images. Check bitmap dimensions, resize in your image loader |
command |
Too many draw commands. Too many layers, too deep a hierarchy |
swap |
The GPU did not free up in time to present. Usually a symptom of heavy gpu |
gpu |
GPU saturated. Overdraw, blur, shadows, alpha layers, large textures |
delay |
Main thread blocked. IO or network on the wrong thread |
max > 100 ms with healthy p95 |
A one-off hitch. Ignore it |
frz above zero |
The UI visibly froze. Look for long work on the main thread |
gc rising with jank |
Allocations in a hot path (composition, scrolling). Profile allocations |
mem near the limit |
Close to OOM. Look for a leak or oversized caches |
Trusting the numbers
The panel renders in its own window, so it does not appear in the metrics of the window being measured.
Three things do distort readings, and the panel tells you about all of them: drop above zero means
the system discarded reports before delivery, so averages and percentiles are undersampled; therm
showing throttling means the device has clocked itself down and the timings are not comparable to a
cold device; EMU in the header means an emulator. Reports carry these and more as confidence
issues next to the stats, each naming the figures it taints.
On an emulator
An emulator renders through the host machine, so sync, command, swap and gpu time a desktop
GPU and say nothing about a phone. Their section headers read RENDER · host and GPU · host, the
rows are greyed out, and the verdict never names them. pipe still does when the bottleneck lands
there, greyed out with the rest.
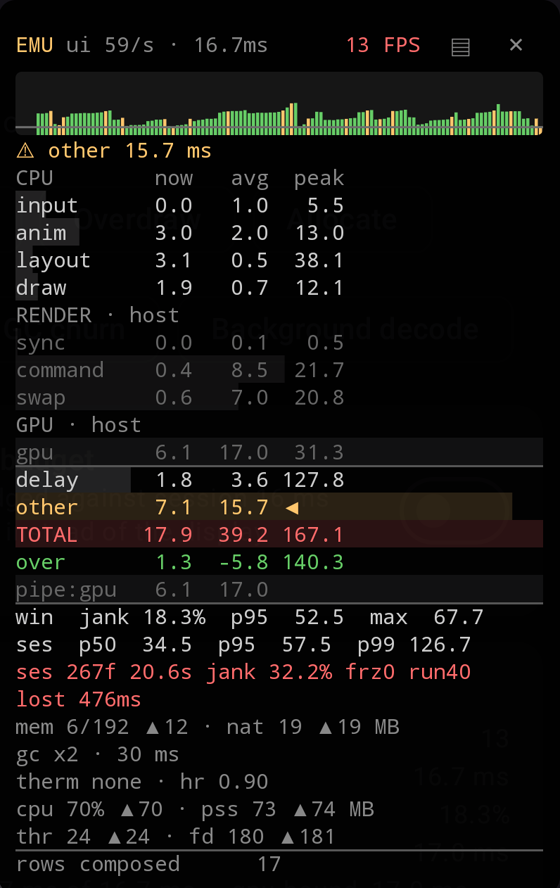
What survives is everything the app itself is responsible for: input, anim, layout, draw,
delay, TOTAL, jank and the session aggregates. Those are the numbers a jank gate reads, which is
why the gate is worth running on CI even though the rendering is not a device’s.
Expect a large other: an emulator leaves more of the frame outside the phases the platform reports,
so the verdict often lands on that remainder rather than on a stage.